Formlume · About

Urban form, illuminated.

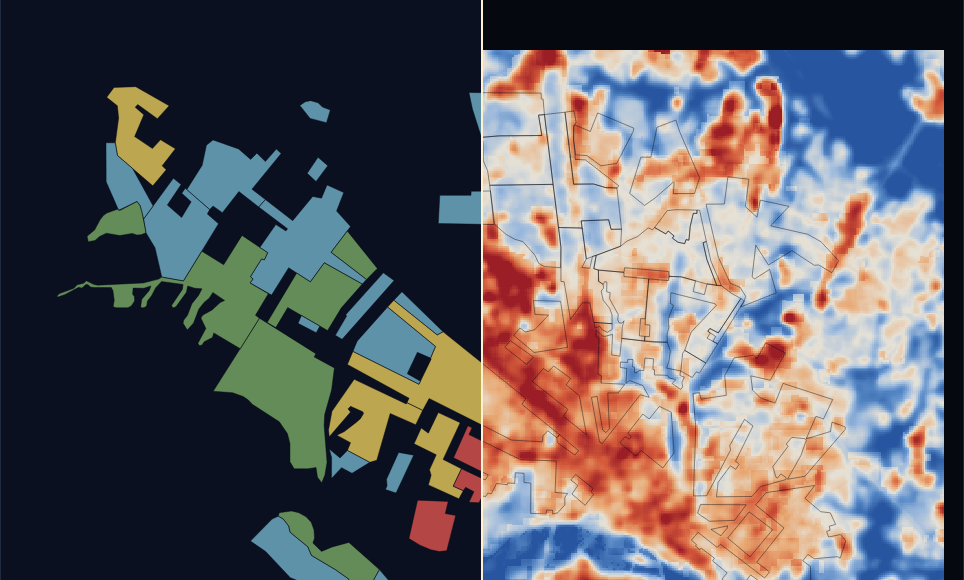
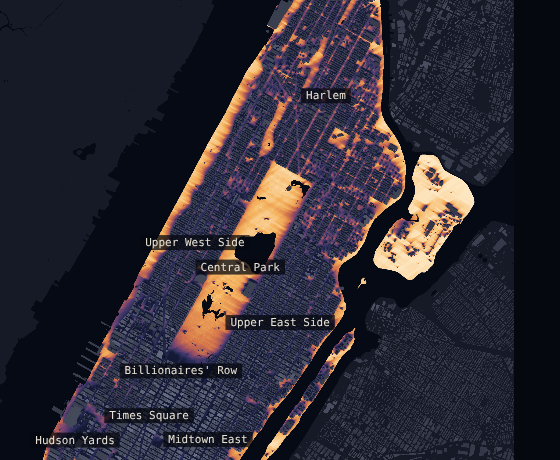
Formlume turns open data into maps and models that show how cities are shaped, how they grow, and what that shape does to the people who live in them.

Every city is an argument made in streets, blocks and buildings. Most of that argument is invisible from the ground: who gets shade, how far the nearest school is, which neighbourhoods were built in a decade and which over centuries. Formlume makes it visible.

Each project starts from a public dataset, such as satellite imagery, census counts, building footprints or transit timetables, and states its method and its limits. Then it lets you explore: search your own city, scrub through time, compare places that are rarely put side by side.

Formlume is the research practice of Stefan Al, architect, urban planner and author, who directs the Master of Urban Planning program at Hunter College, CUNY.
01 · Data first

Start from evidence

Open, citable sources, processed the same way for every city, so comparisons are fair.

02 · Form first

Look at the shape

Not just how many people, but where, how high, how close together, and in what pattern.

03 · Open to read

Show the work

Every page states its method, limits and how to cite it, and each one leads with a finding in plain words.

A lineage

Four thousand years of drawing the city

Formlume belongs to a long line of drawings that made cities legible: from the first plans scratched in stone and clay to the maps that changed how we fight disease and house the poor. Each one found a new way to see.

c. 2100 BCE

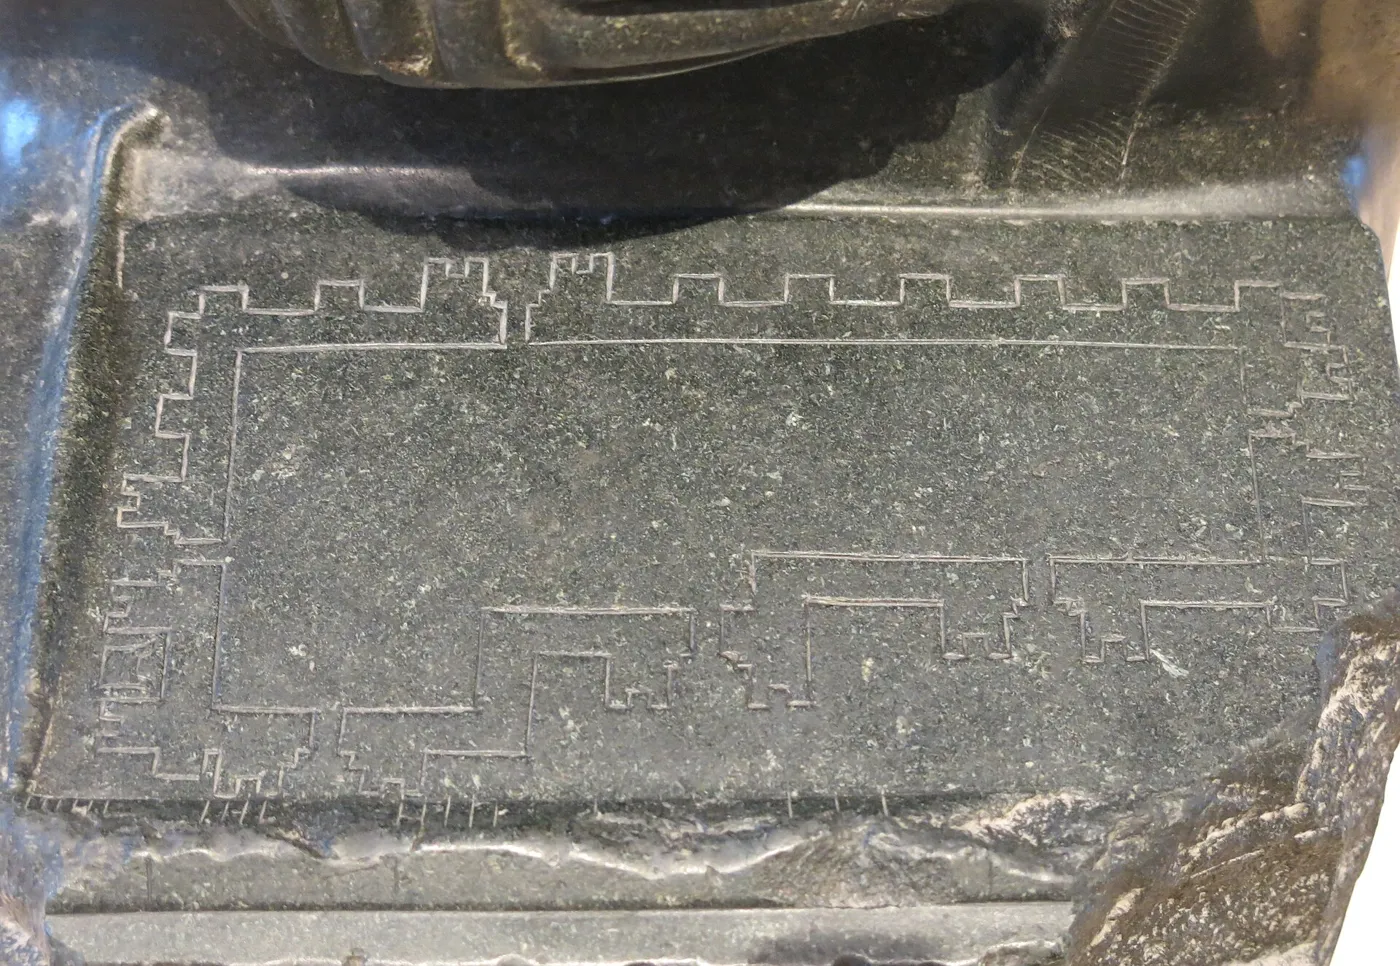
The first architectural plan

Gudea, ruler of Lagash in Sumer, had himself carved as an architect. On his lap rests a tablet with the plan of a temple enclosure, its walls and buttressed gates incised in diorite, beside a measuring rule and a stylus.

To build a place, someone first had to draw it from above.

Detail of a diorite statue: a tablet on the seated figure's lap is incised with the outline of a walled enclosure with stepped buttresses.
Statue of Gudea, “Architect with a Plan”, Girsu. Louvre, AO 2. Photo: Tangopaso, public domain.
c. 1400 BCE

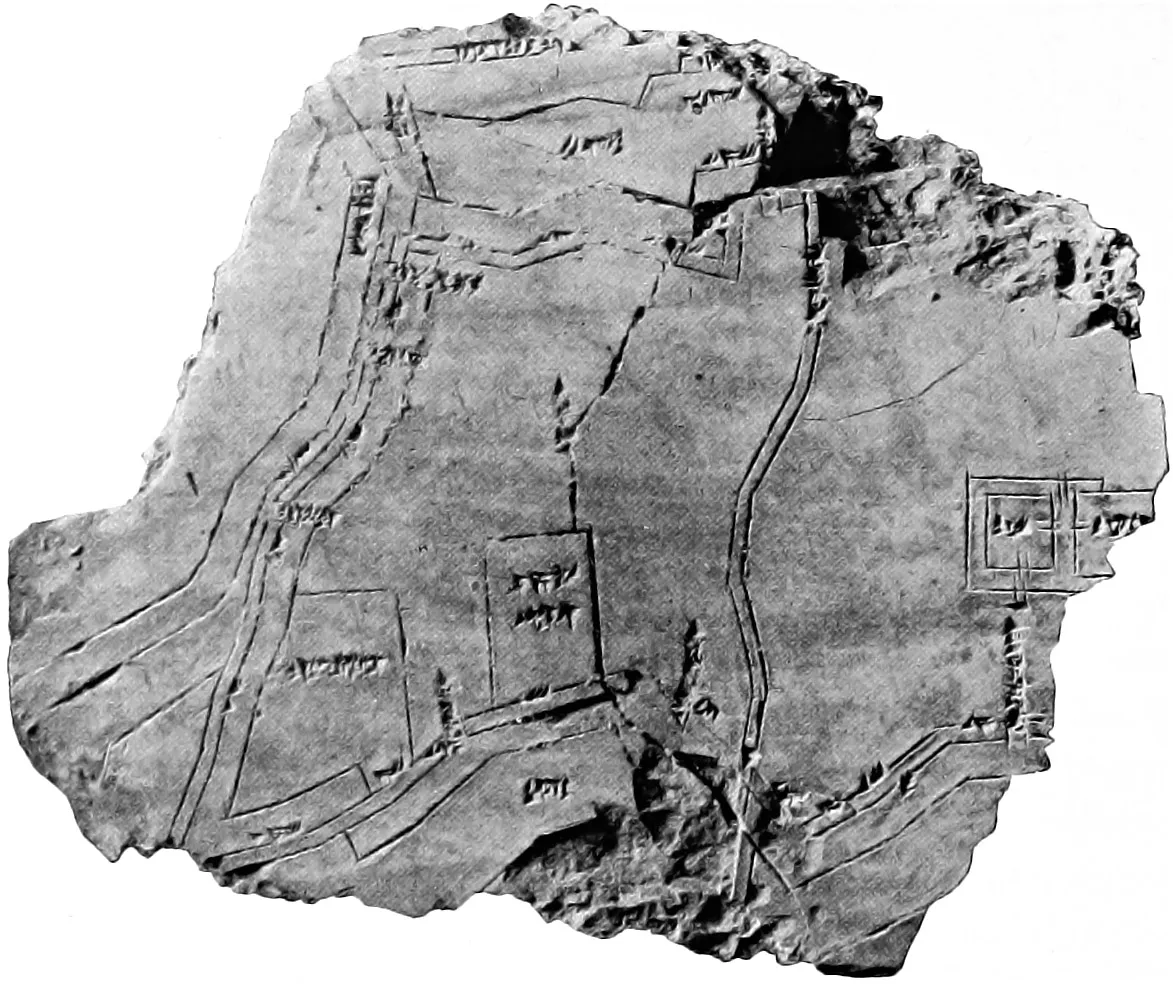
The oldest known city map

A clay tablet from Nippur in Mesopotamia shows the temple of Enlil, a park, the city wall and its gates, a canal and the Euphrates, each labelled in cuneiform. When archaeologists compared it with the ruins, it turned out to be drawn close to scale.

The map as a record of a whole city, not just a building.

A broken clay tablet incised with lines for walls, a river and a canal, with small cuneiform labels.
Plan of Nippur, Hilprecht Collection, Jena. From H. V. Hilprecht, 1903, public domain.
1748

Nolli’s Rome

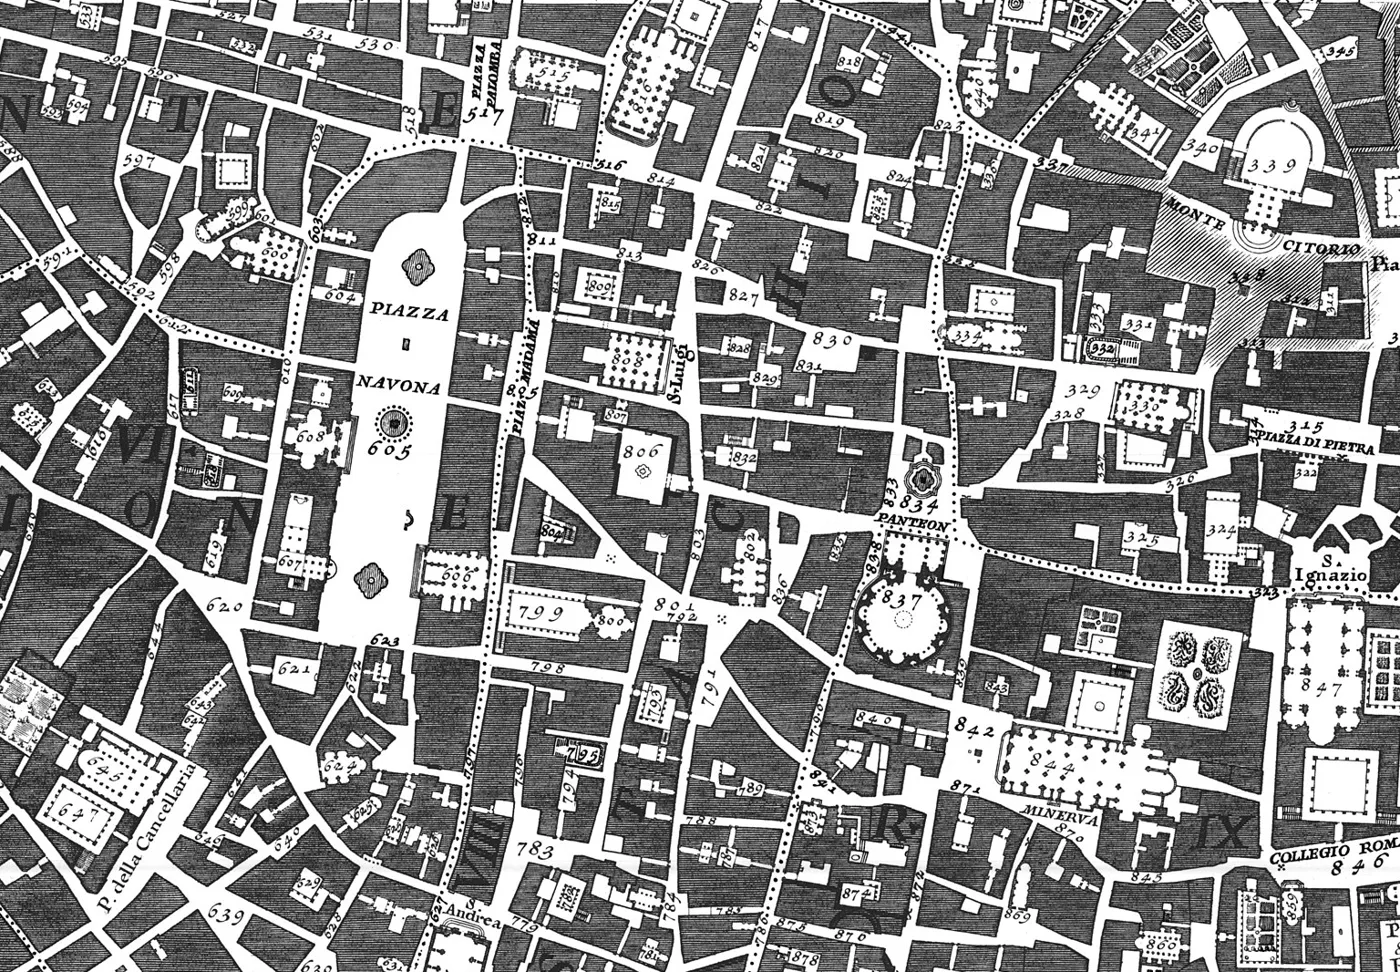
Giambattista Nolli spent twelve years surveying Rome for his twelve-sheet Nuova Pianta di Roma. He drew private buildings as solid and left public space white, including the interiors of churches and the Pantheon, so the map reads as one continuous public realm.

A map can make an argument: here is the city that belongs to everyone.

Engraved plan of central Rome with buildings hatched dark and streets, piazzas and church interiors left white; Piazza Navona and the Pantheon are visible.
G. B. Nolli, Nuova Pianta di Roma, 1748, sheet 5 (detail: Piazza Navona and the Pantheon). Public domain.
1854

John Snow’s cholera map

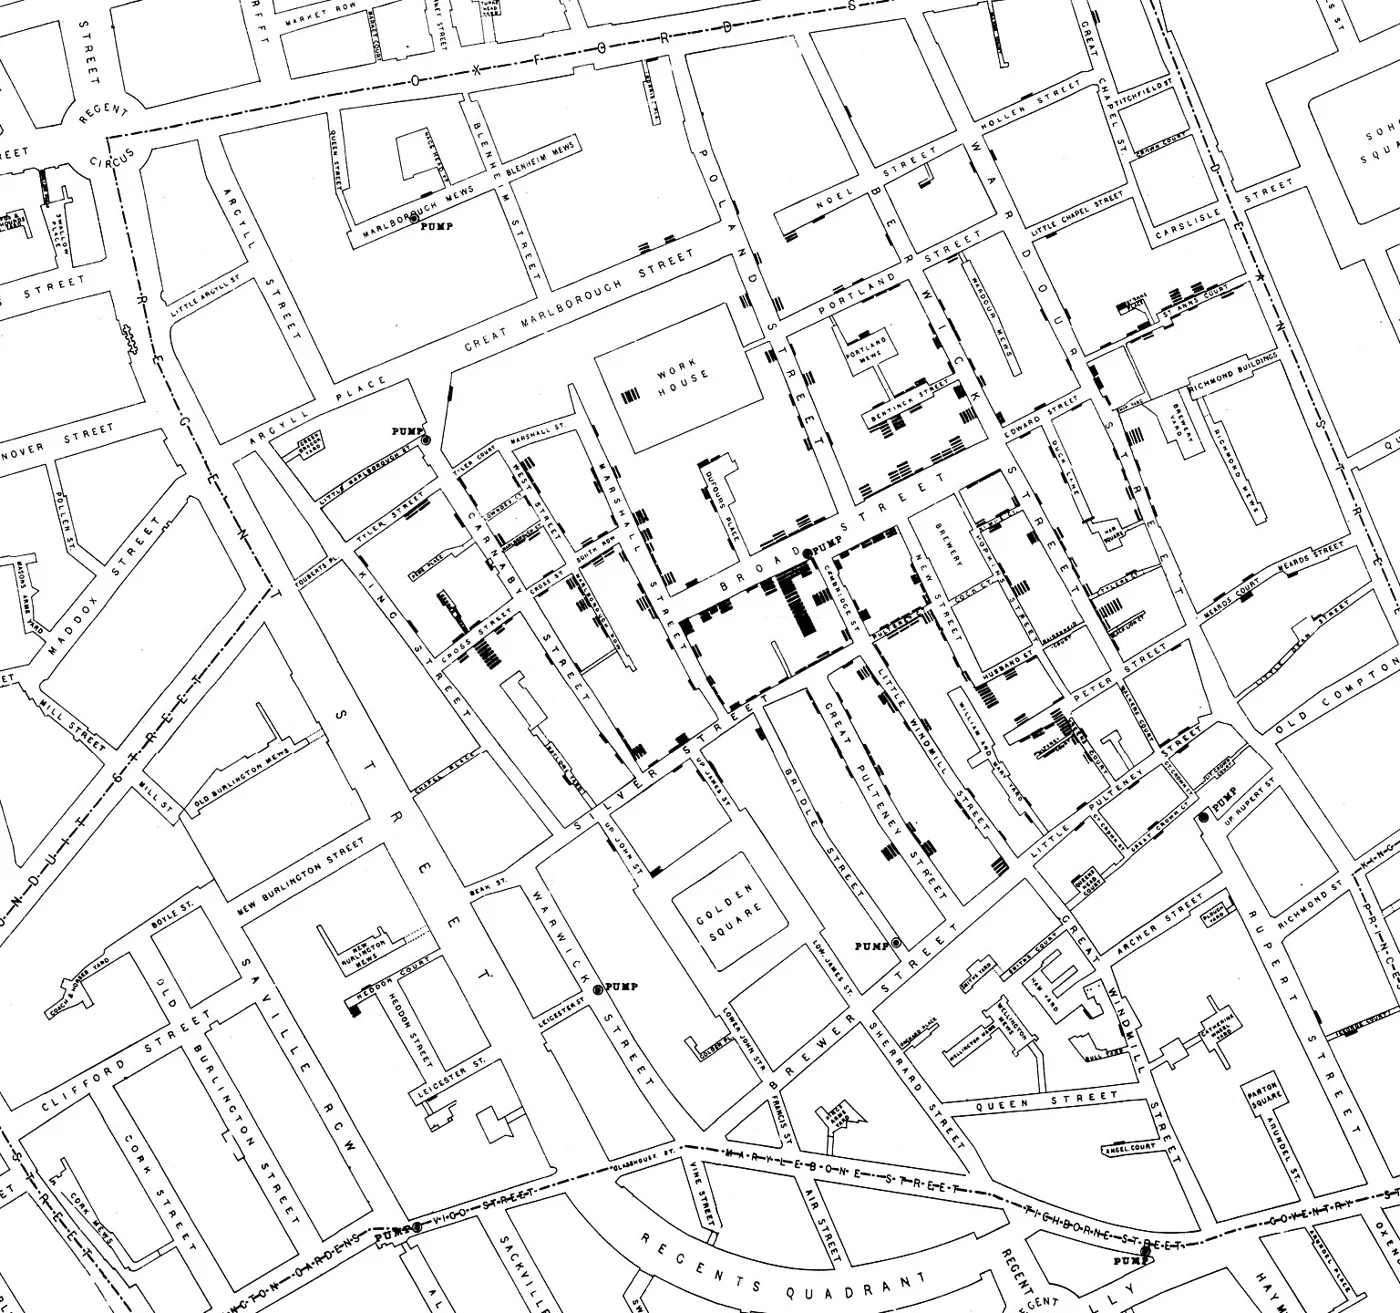
During the Broad Street outbreak in Soho, the physician John Snow plotted each death as a small bar at its address, alongside the neighbourhood’s water pumps. The deaths clustered around a single pump, evidence that cholera spread through water, not foul air.

Plotting data in space can reveal a cause no one could see in a table.

Street map of Soho with stacked black bars along the streets marking cholera deaths, densest around Broad Street.
John Snow, On the Mode of Communication of Cholera, 2nd ed., 1855; lithograph by C. F. Cheffins. Public domain.
1890

The tenements of the Lower East Side

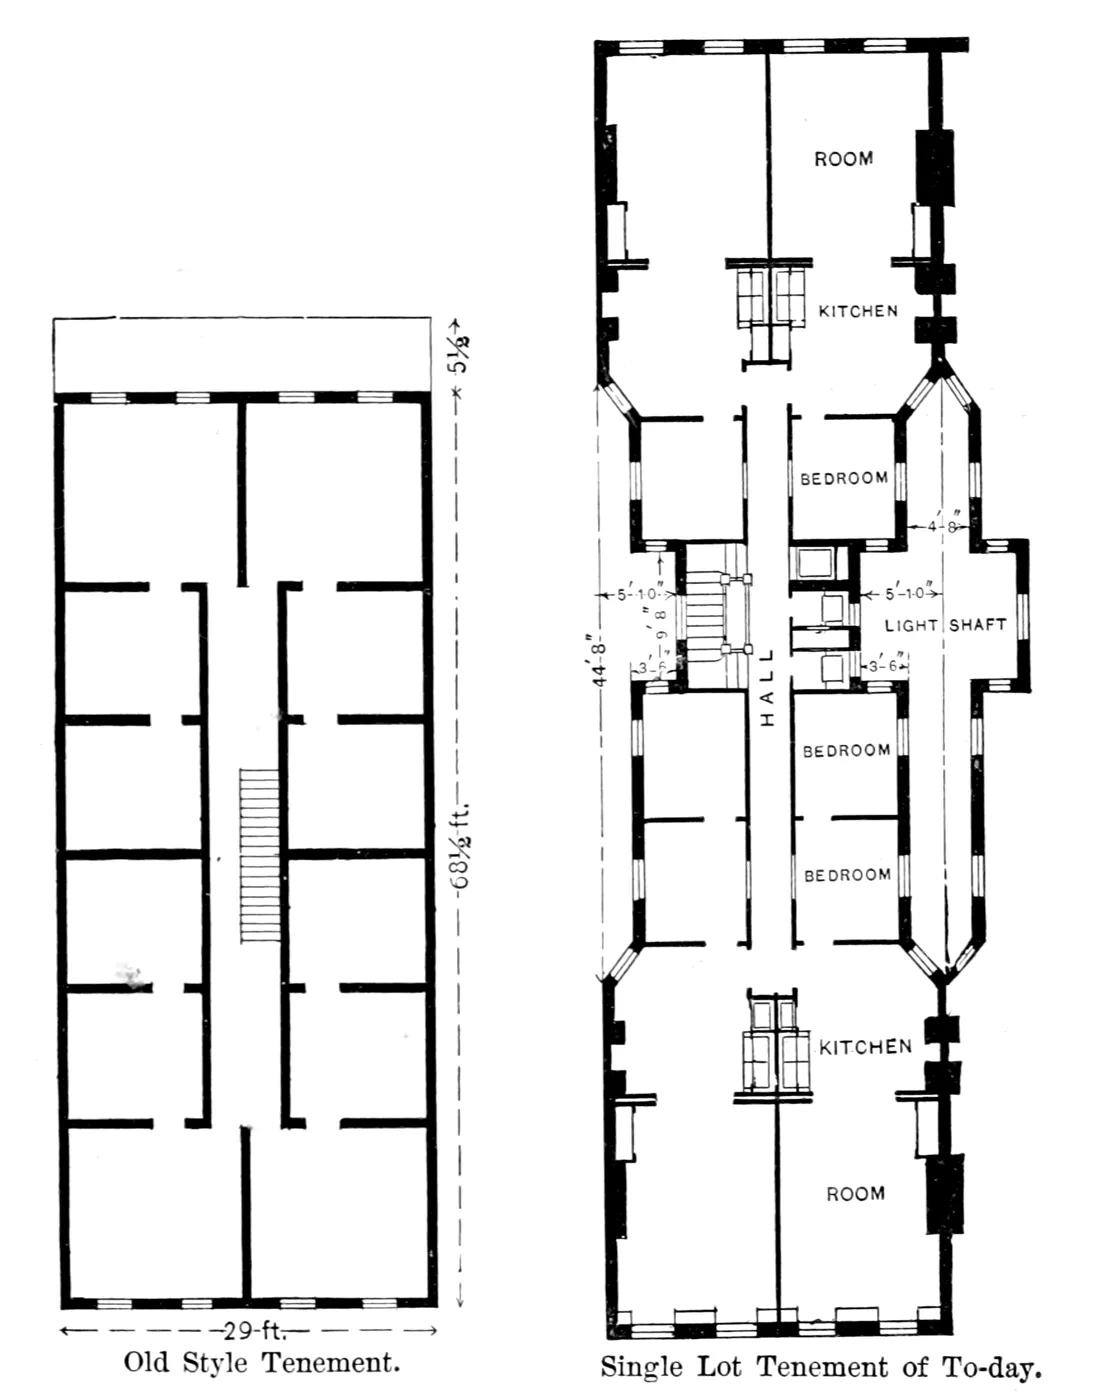
New York’s tenements packed families into rooms with no window to the outside air. Reformers like Jacob Riis used drawings to show it: the old tenement on its 25-by-100-foot lot, and the “dumbbell” that the 1879 law produced, with a narrow light shaft pinched into each side. Reform followed in the Tenement House Act of 1901.

Drawings of form became arguments for law.

Two floor plans side by side: an old-style tenement with windowless interior rooms, and a dumbbell tenement with a narrow light shaft.
Jacob Riis, “Evolution of the tenement in twenty years”, How the Other Half Lives, 1890. Public domain.
Before Formlume

Two decades of mapping cities

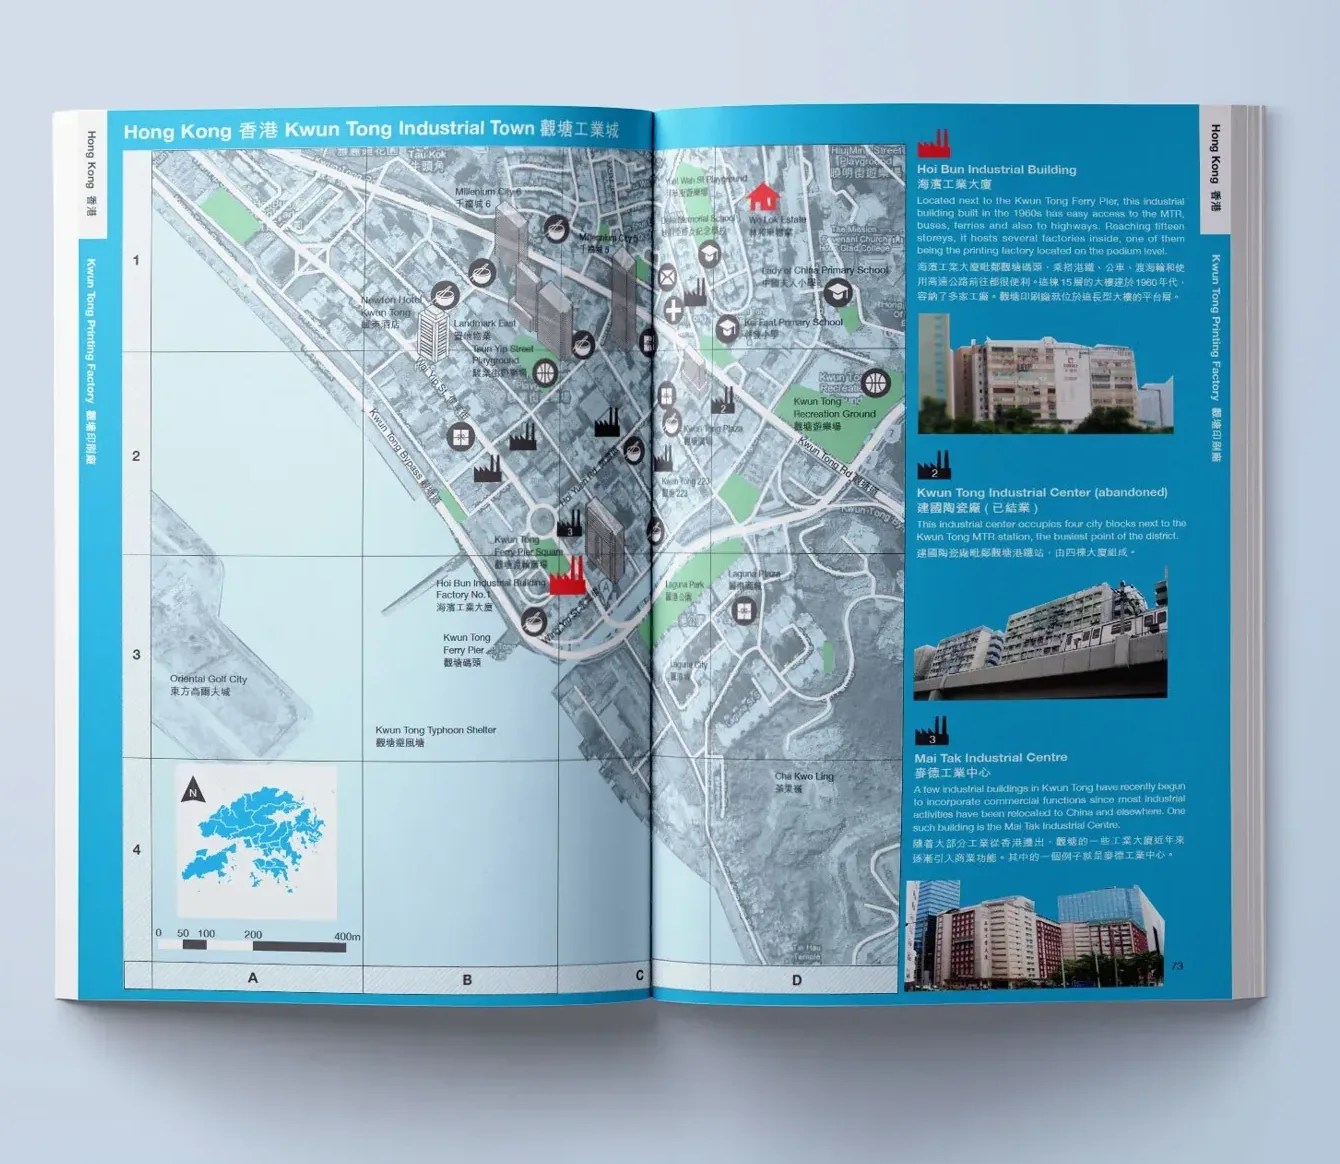
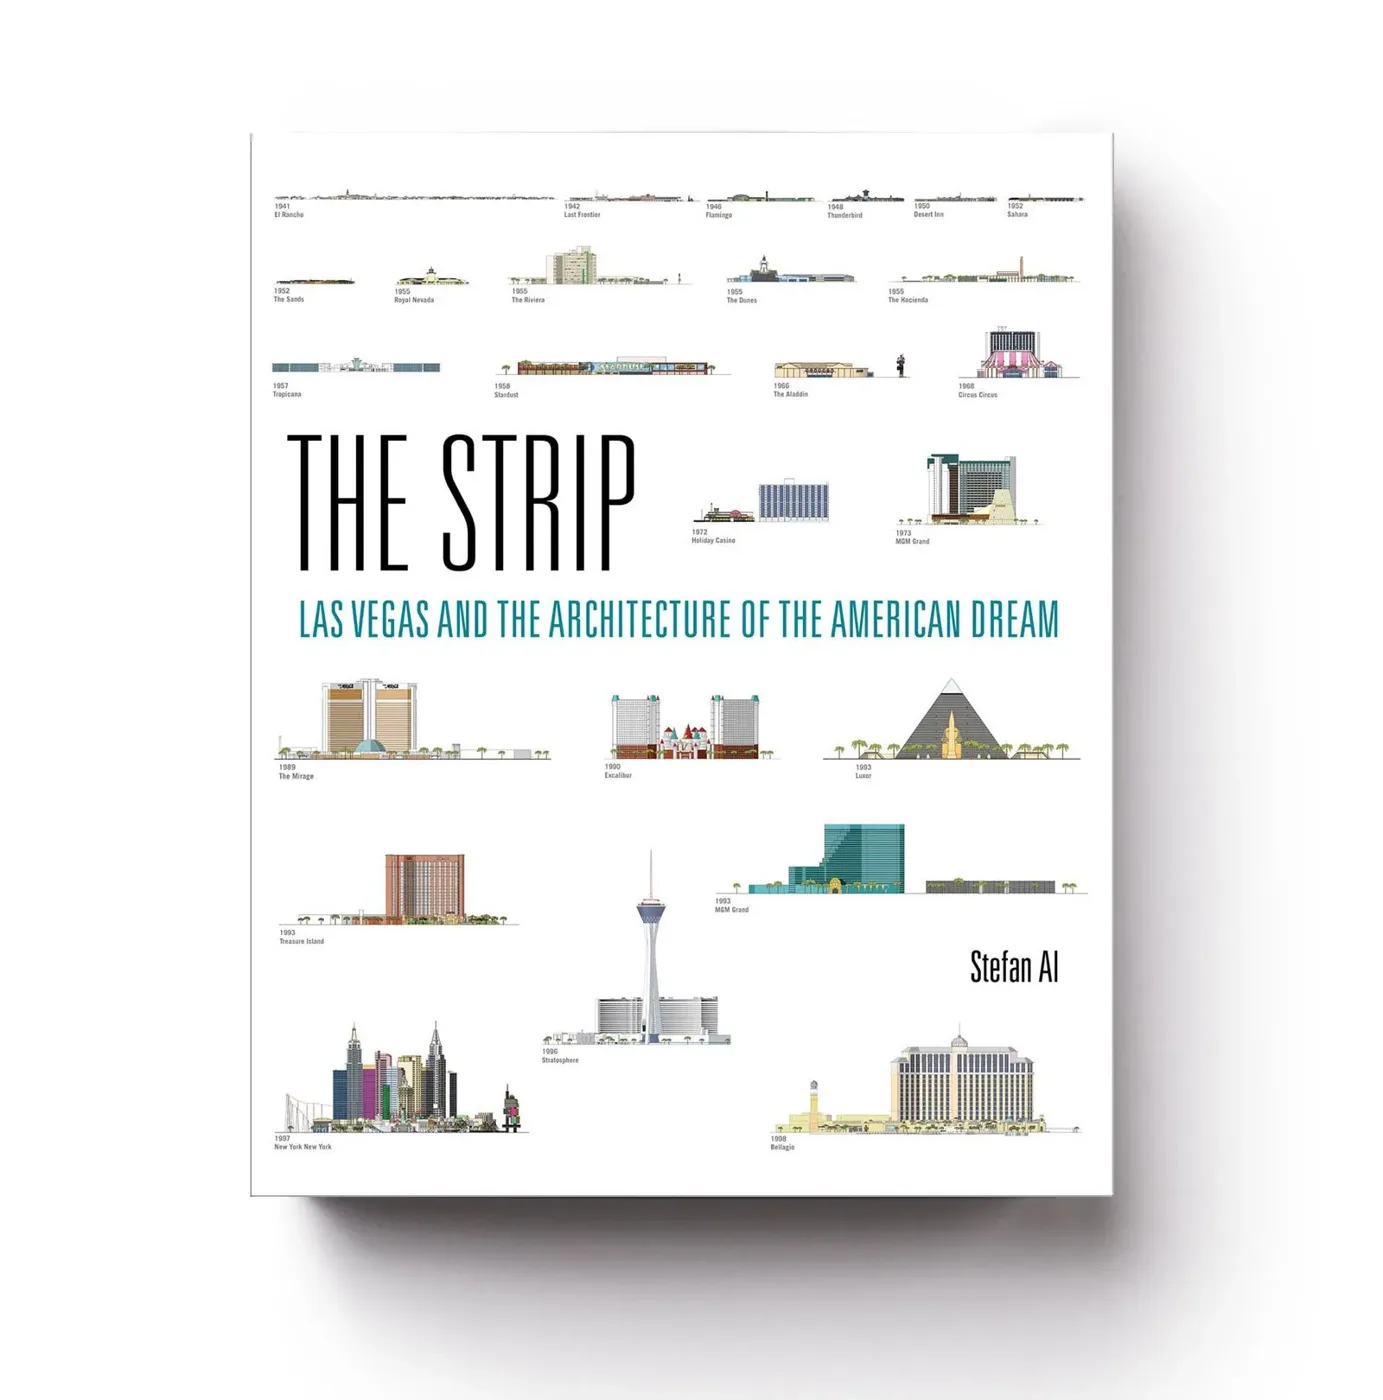
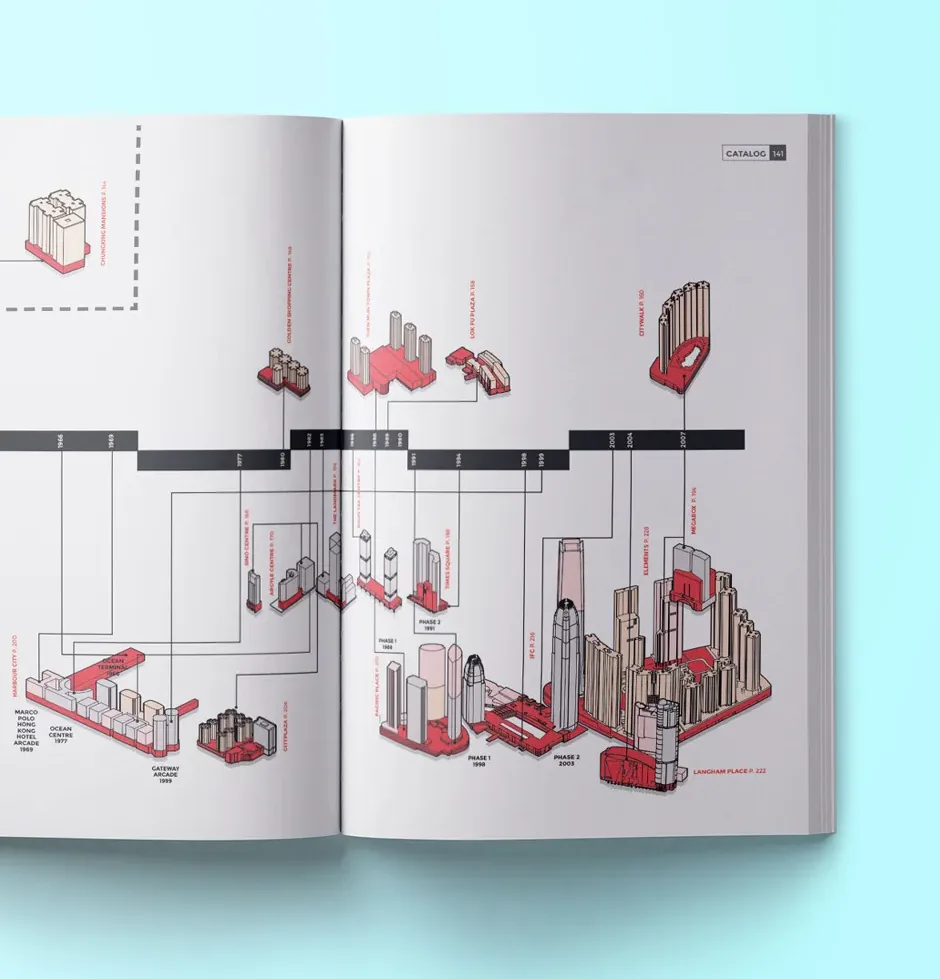
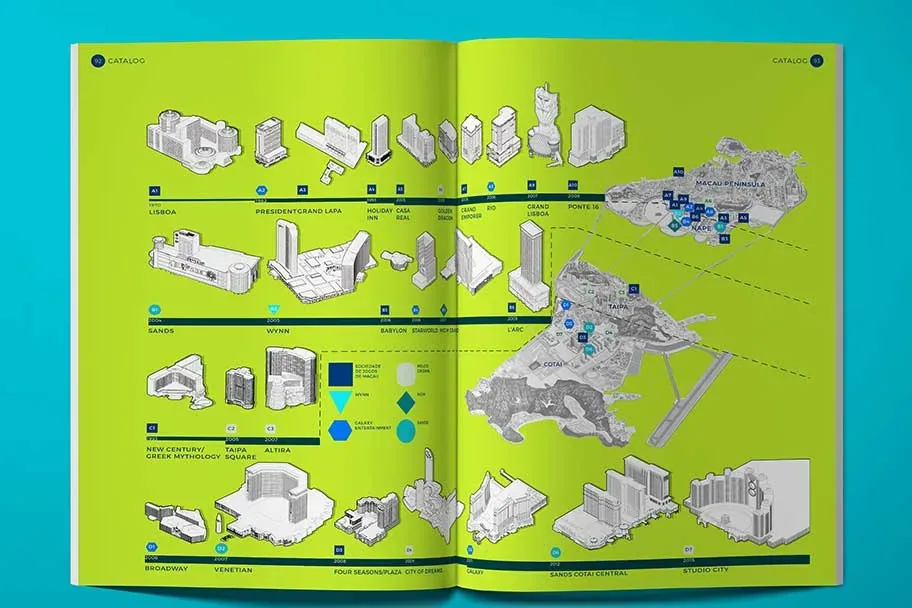
Formlume grew out of a series of books in which Stefan Al and his students documented fast-changing places through drawings, sections and maps: the factory towns and urban villages of the Pearl River Delta, Hong Kong’s malls, Macau’s casinos and the Las Vegas Strip.

Highlights

What Formlume has found

A few of the projects so far. See all research →

Suggest a visualization

What should Formlume map next?

The best questions come from people who know a place: a planner, a teacher, a resident, a reporter. Tell me what you care about and what you wish you could see.

  • A question about your city or neighbourhood that a map could answer
  • A dataset you think deserves to be seen
  • A comparison between places that no one has drawn
  • A project you would like to collaborate on, for teaching, reporting or policy
Send a suggestion →

info@stefanal.com · I read every message, though I can’t take on every idea.

Image credits
  1. Statue of Gudea (detail), Louvre AO 2. Photo by Tangopaso, public domain. Wikimedia Commons
  2. Plan of Nippur, from H. V. Hilprecht, Explorations in Bible Lands, 1903. Public domain. Wikimedia Commons
  3. G. B. Nolli, Nuova Pianta di Roma, 1748, sheet 5 (detail). Public domain. Wikimedia Commons
  4. John Snow, map of cholera deaths in Soho, 1854 (detail). Public domain. Wikimedia Commons
  5. Jacob Riis, Evolution of the tenement in twenty years, 1890. Public domain. Wikimedia Commons
  6. Book spreads and covers © Stefan Al and the respective publishers.